

Ruben Arslan @rubenarslan@schelling.pt
- Website
- https://rubenarslan.github.io
- The 100% CI
- http://the100.ci
- Formr.org
- https://formr.org
- https://twitter.com/rubenarslan
Bayescurious evidence enthusiast http://the100.ci
Topics: evolution, ovulation, mutation, intelligence, personality, sexuality, R, open science & source tools.
Joined Feb 2023
RT @Sam_Dumitriu
Rishi Sunak just announced up to £50m in funding for new “focused research organisations.”
FROs are a new way of doing science. In effect, they apply the startup model to scientific research. 🧵
RT @Sam_Dumitriu
What might a Biobank FRO look like?
Our paper sets out one idea — a biobank family study.
RT @jrgptrs
Is Economics self-correcting? We have a new discussion paper, joint with N Fiala & @flneubauer. Quick answer is: No, rather not. We reviewed all replications published as comments in the AER. Plus, we surveyed the authors. A short thread 1/. http://bit.ly/3y0wMYp #EconTwitter
If anything, I see this episode as evidence that adversarial collaborations with a massive power differential don't work.
Like, income explains <1% in well-being. It's loglinear, i.e. diminishing returns. But there has to be a threshold too? How much cope do you need?
---
RT @rubenarslan
@AaronCharlton If I fit a spline on the 15% quantile, it doesn't seem like the threshold is 100k either, more like 200k. Not that this nonlinear fit i…
https://twitter.com/rubenarslan/status/1631661372126687232
RT @tkaiser_science
Finally, it's online: our paper on using synthetic control groups for naturalistic psychotherapy outcome data.
(me, @evalottabra, @herzog_ph)
Using this link, the first 50 copies are free:
https://tandfonline.com/eprint/3KX3MFZPTZNNDEWCQVVV/full?target=10.1080/10503307.2023.2182241
🧵👇
RT @rubenarslan
@AaronCharlton Can I see the distribution from Kahnemann and Deaton (Gallup Health Well Being Index) anywhere? Not reported afaict. Website is down http://wellbeingindex.sharecare.com/
RT @rubenarslan
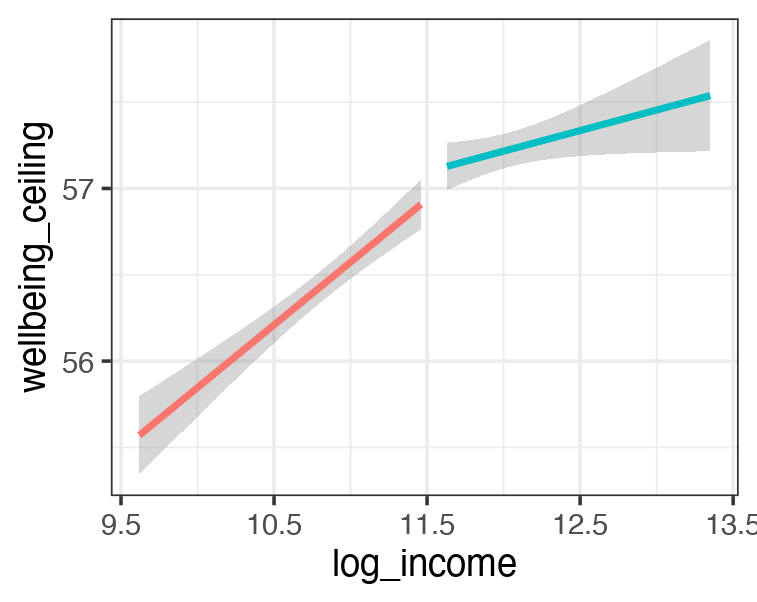
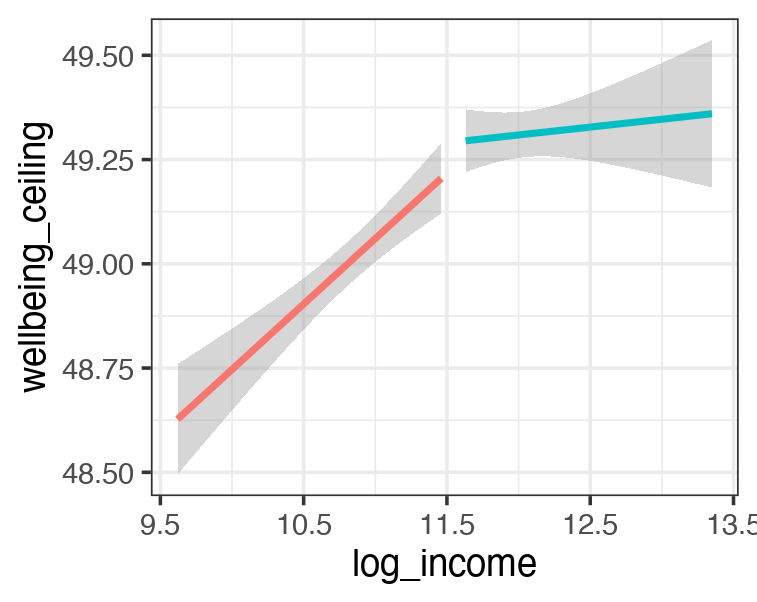
@AaronCharlton Also, I have to induce an artificial ceiling effect of at least the scale midpoint (50) to see the line flatten. Look at that distribution.
RT @rubenarslan
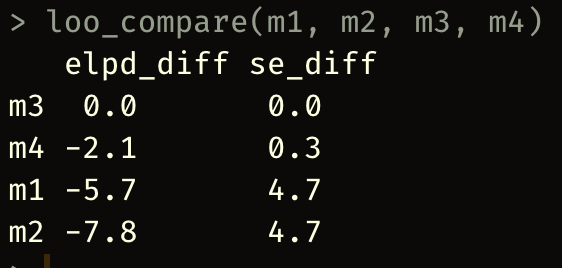
@AaronCharlton I'm a simple man, I see someone claiming that they found just the right quantile regression after lots of tinkering, I run a LOO comparison between a location scale model with and without the moderator.
RT @dingding_peng
I’ve seen a lot of confusing interpretations of statistical models, but reporting a quantile regression as if it were conditioning on the outcome probably takes the cake, but only for people who have taken only little cake.
why can someone who is heartbroken at an income of 10k buy an ice cream cone and be happier, but someone with an income of 110k just cannot alleviate his heartbreak with ice cream and a nice spa visit
> This income threshold may represent the point beyond which the miseries that remain are not alleviated by high income. Heartbreak, bereavement, and clinical depression may be examples
except happiness is normally distributed and subject to many additive effects
It couldn't be that Kahnemann made a beginner's mistake and interpreted a ceiling effect in his outcome as a moderator. No, "conventional practice" dictated labelling the outcome variable happiness, rather than unhappiness.
Tenure is one hell of a drug.
https://www.pnas.org/doi/10.1073/pnas.2208661120
RT @dingding_peng
Secular trends in haphazard analyses of secular trends: A haphazard analysis.
correction: I misread the part about a larger effect in arts/music/literature. afaict, they didn't test that and I wished too hard that they did. effect sizes make more sense now.
thanks @Scientific_Bird
thanks to @TaymAlsalti for a potential explanation
https://youtu.be/10Jp5SiBezQ
though I had to update on one thing: I thought the effect would be bigger for girls, because of some not-so-fond memories of male teachers at my high school. not the case here.
I thought there would be an effect, but the effect size surprised me! It's half as large as the IQ effect and if you compare the least to most attractive, the differences beat sex, migration background and parental education (yeah Table 2 fallacy, I know I know).
A lunch discussion on beauty premiums in school led me to dig this up. As I read it, one SD (.72) in attractiveness is associated with a .4 increase in grade point (from 6 to 1) in math exams and 1.3 points in arts/music/literature. 10 and 15 year olds.
https://www.degruyter.com/document/doi/10.1515/zfsoz-2012-0206/html
RT @ianhussey
Help me with a 30 second study to understand the measurement precision of the Visual Analogue Scales used in a published study?
Take a piece of paper, a ruler and a pen, and draw a 16 centimeter line. 🧵
RT @AlexTISYoung
A subtle point that this paper makes concrete is that confounding in the GWAS used to make a PGS complicates the interpretation of within-family estimates of PGS associations across traits: i.e., just because PGS of trait 1 predicts trait 2 within-family, that doesn't imply… https://twitter.com/i/web/status/1630380670311874561
- Website
- https://rubenarslan.github.io
- The 100% CI
- http://the100.ci
- Formr.org
- https://formr.org
- https://twitter.com/rubenarslan
Bayescurious evidence enthusiast http://the100.ci
Topics: evolution, ovulation, mutation, intelligence, personality, sexuality, R, open science & source tools.
Joined Feb 2023
